Continuing my earlier rant about how real estate statistics don’t always tell an accurate story, let’s look at what Menlo Park’s numbers seem to indicate for our ongoing robust spring market.
First, a recap: courtesy of our good friends the quant jocks over at Altos Research, we saw that the median price numbers for Menlo Park had dropped by some 30% — from $1.25M to $850K — over the 9 month period from April of 2007 to January 2008.

That drop in median price, however, by no means reflected the reality on the ground in Menlo Park — in other words, it is not true that a home in Menlo Park that was worth $1M in April 2007 was suddenly only worth $700K in January 2008. The reason for that disconnect was simply the change in the mix of properties being offered: in the last half of 2007, the inventory of lower priced homes east of 101 swelled, dramatically pulling down the overall median.
As if to emphasize that disconnect, we see what appears to be a dramatic price recovery from January of 2008 to now in May of 2008; in fact, it looks like the market has regained all 30% of what it ostensibly lost late last year!
Again, the reality on the ground is quite different; that is, a Menlo Park home that was worth $1M in January of 2008 is most emphatically not suddenly worth $1.3M today.
Moral of the story? Simple: real estate statistics are good at telling some stories, but not very good at telling others. In particular, the median often simply reflects the mix of properties currently on the market and not necessarily any underlying ups or downs in the market.
Tags:
Consumer,
Industry,
Menlo Park
[Read more →]
Tags: Consumer · Industry · Menlo Park
If you’re Eliot Spitzer, probably three feelings come to mind: panic, disorientation and regret. But if you’re a potential home buyer in the Peninsula region of California, you have good reason to feel excited, encouraged and confident! Why? If you read my last post last month, you know that the conforming loan limits for many California Counties are going up and that means cheaper mortgage rates on loan amounts between $417,001 and $729,750. Now that HUD has made it official that ALL bay Area counties qualify for the revised maximum conforming loan limit, that means potentially big savings on mortgages for qualified applicants looking to purchase single-unit properties up to $810,000 with as little as 10% down!
We’ve all heard the cliche, “the devil’s in the details”, so what are the latest requirements to obtain a conforming loans between $417,001 and $729, 750? Since I’ll provide you with a link to Fannie Mae website and announcement , I’ll provide you with some highlights that I think are most relevant and let you read further at your leisure:
1. Single-unit properties only
2. Purchase and “limited cash out” transactions only (i.e. no greater than $2,000 going into your pocket upon settlement)
3. If primary residence purchase, up to 90% loan-to-value (”LTV”) allowed if fixed-rate program is selected–700 minimum FICO(R) required; 80% LTV if an adjustable-rate loan is selected–660 minimum FICO(R) required; if refinance
4. If second home or investment property purchase, maximum 60% LTV allowed with minimum 660 FICO(R) regardless of eligible loan program selected
5. If refinance, regardless of type of eligible mortgage program, up to 75% LTV allowed, plus subordinate financing allowed in addition up to 20% LTV–660 minimum FICO(R) required
a. SPECIAL NOTE, consolidating existing first mortgage and subordinate mortgage into one loan NOT eligible AND six months of “seasoning” (six payments made on existing mortgage) required to refinance!
6. Loans are eligible for origination NOW
7. Eligible programs include 30-year fixed, 15-year fixed, LIBOR-based 5/1 ARM (amortized and interest-only payments allowed for this program)– more programs may become available
8. Sufficient employment, income and assets must be verified and each file will require manual underwriting– automated underwriting engines not allowed at this time
Again, I do encourage you to read the Fannie Mae announcement from the 6th of March for all the details, but the above are the top highlights.
So what will pricing look like on these “new” conforming mortgages? Well, pricing has just recently been released by only a few institutions, but it looks like the 30-year fixed is running at about 6.375% and the 15-year fixed is running at about 6.25%. The 5/1 ARM pricing is expected to be released next month. What I do think is that pricing may actually get a little better in the short term as more institutions post pricing and auctions are successful with Fannie Mae and Freddie Mac.
What’s right for you as a would be home buyer on the Peninsula? That depends of course on your specific situation, and I do encourage you to consult with your trusted mortgage and financial consultant before placing an offer on a home or refinancing your mortgage. What I can say is that the majority of our clients who are buying or refinancing today are selecting a jumbo 5-year ARM in the mid-5% range due to its balance of savings, security and flexibility.
Tags:
Buyers,
Consumer,
For buyers,
Home buying,
Industry,
Menlo Park,
Mortgage,
Mortgages,
Mountain View,
Palo Alto,
palo-alto-real-estate,
Real estate,
Real estate blogging
[Read more →]
Tags: * Type of Content · Buyer · Buyers · Consumer · Industry
Zillow Tells Tales Of Housing Woe … Meanwhile, Back At The Ranch, Multiple Offers Are Back In Vogue…An Object Lesson In “All Real Estate Is Local”
February 11th, 2008 · 9 Comments
Embargoed for release until 9:00pm (hence the 9:01pm time stamp!) is the news that Zillow has just released their Q4 2007 analysis. It ain’t pretty.
Giant swathes of the country are bathed in the bright red color of price decreases and upside-down homeowners…here, for instance, is the national map of homes with negative equity. The bubblistas are gonna love this one!

Here’s how to interpret that map: 50% or more of the homes bought in 2007 in, say, Modesto are now worth less than what the owner still owes on the property. Sounds pretty grim, and it certainly is if you’re one of those homeowners…especially since we Californians have taken it as our God-given right to have property appreciate steadily year on year.
Here’s a map I’d like to see: the percent of homes bought in 2005, 2004, 2003…pretty much any year going back which are now “under water.” Instead of bloody red color so much loved by the bubblistas, we’d see a map bathed from sea to shining sea — including even the fabled fruited plains themselves — would be painted a joyful bright green, the color signifying “0% to 10%.” In fact, the map would have to be modified to show the precise number 0%.
Moral of that story: I feel your pain, trust me. If you bought a home in 2007 in Modesto, and life circumstances force you to sell it in 2008…your life sucks. Absolutely. But what about those who can stick it out for 2, 3, perhaps 5 years that this market will remain sucky for much of the country? Life for them won’t suck. Absolutely.
Let’s examine San Mateo County. Zillow’s “Z-index” for the whole county shows a 5.5% drop — that’s right, a drop — quarter on quarter. Translation: If in 2007 Q3 you bought a hypothethical home that covered the entire county, that home’s value dropped by 5.5% by Q4 of 2007.
Sounds grim, right? Again, let’s look at the whole story…
Here’s a city-by-city heat map of price appreciation from Q4 2006 to Q4 2007 … and in this map, red is good (at least for homeowners; for perma-renters and bubblistas it gives heartburn.)

Interpretation:
Huge swathes of San Jose, the East Bay and further inland, plus some pockets of the Peninsula — like East Palo Alto and South San Francisco and Redwood City — are down, in some cases dramatically. Most of the Peninsula, however, saw price increases from 2006 to 2007; in particular, the marquee towns of Palo Alto, Menlo Park, Atherton, Cupertino, Los Gatos, and Saratoga saw prices go up 10% or more.
Folks, it’s a mixed message out there: a lot of the country is in pain. But just remember this, as always: Real estate is local, local, local. Just because prices in Vegas haven’t fallen doesn’t mean you should sell your particular home and live in a tent. You need to look at the price trends in your neighborhood.
Oh, and the “multiple offers” mentioned in the title? Here’s a small sampling of what the rumor mill says has happened in the last week…
- Saratoga — $1.8M - ish –> 15-20 offers (two incidents)
-
San Carlos — $850K - ish –> Two properties sold with a combined 13 offers. (Hat tip to Arn Cenedella, a Menlo Park Realtor, for providing that particular juicy piece of gossip.)
Tags:
Atherton,
Consumer, Cupertino, East Palo Alto,
Industry, Los Gatos,
Menlo Park,
Palo Alto,
Redwood City, San Carlos, Saratoga, South San Francisco,
Zillow
[Read more →]
Tags: Consumer · Industry
I recently read a great post from Dan Green, a mortgage planner in Ohio, titled, “While Rates Are Low, Schedule Your Purchase Closing At Least 45 Days Out “, and I wanted to remind any potential home buyers searching within or around Palo Alto, CA that local sellers are still requiring a 30-day or less close. Thanks to our main man, Dr. Boer, for bringing this blog to my attention.
Dan does have some great points about turn times deteriorating, underwriters being more cautious and resources being slimmer. All of these concerns are valid and may press the close date on any transaction. Thus, it’s important to verify with whomever you select as your lender what the timetable looks like for your situation. As a general rule, purchase transactions are given higher priority than refinance transactions.
The reality is that we have worked on two transactions already this month where the close date was ten days or less from contract ratification. In fact, one call I received yesterday asked whether a month-end close would be possible for a client looking to buy a condo in Menlo Park. Yes, a one-week close is possible.
So how can you prepare, and whom can you trust to get your transaction done right and on time? I offer the following:
1. if you have a trusted mortgage lending source, double check to determine whether the institution makes direct lending decisions (usually a direct lender or a mortgage bank)
2. if your trusted source does not make direct decisions (usually a mortgage broker), request a realistic timetable to determine whether your loan will fund in the time required by the contract
3. ask your real estate professional for a referral to a lender that she or he trusts
No doubt, this is a fantastic time to be buying a home: there a some local values out there, rates are phenomenally low (have you seen that 5-year treasury lately, wow! And what a move by the Fed to lower another .75%..!) and our local economy is doing well (check out Iverson’s latest post for more on that subject). The flip side is that the inventory of available homes has not been very encouraging (only four new ones in Palo Alto on Friday– ouch).
My position has always been that you can’t go wrong with purchasing real estate in select areas of the peninsula, provided that your holding period is five years. And if you’re someone with a reliable real estate professional, a reliable lender, reasonable qualifications and a solid plan, you will likely see a nice bump to your net worth over the next five years by making a move sooner than later.
Tags:
Menlo Park,
Palo Alto,
Real estate
[Read more →]
Tags: Consumer · Industry · Mortgage · Real estate
I want to underscore the importance of what Kevin is discussing in his post regarding statistics and the actual market activity that they represent. Because the neighborhoods in Menlo Park are not distinguished by ZIP code or city, which are two popular methods of segregating data, it is easy to draw an incorrect interpretation of what is happening there.
The Band-Aid fix that I have been using with my clients interested in Menlo Park is to explain the nature of the market, and then look at the market data for the upper two quartiles of homes only. Conveniently, the homes in the areas of Menlo Park East of 101 are all below the mean for the whole city, while those West of 101 are generally above the mean overall.
Scott at Altos Research sent me the following interesting bit of analysis of how an outlier can throw off the statistics for an area. It seems there was recently at home in Del Mar in Southern California listed for $76 million.
The Median home price is reflected here (Median = half the homes on the market are listed above this price, half below):
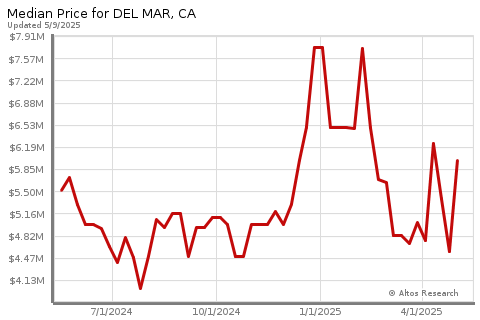
The numbers are weekly, and we can see how having a limited number of data points (homes for sale) bounces the numbers around.
Maximum price for Del Mar during the same period:
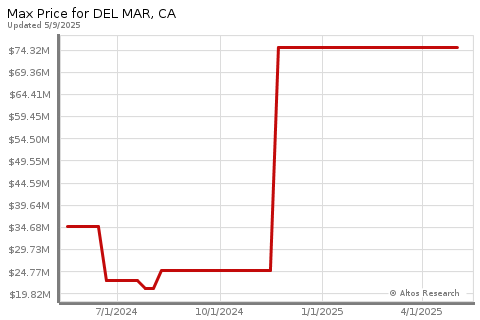
Gee, I wonder when that house was listed, and what the selling commission is?
And here is how the mean (average) price of homes in Del Mar, California is affected as a result:
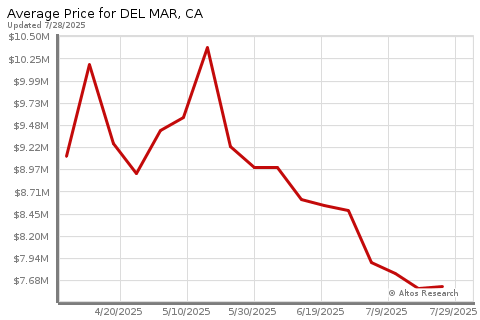
So, the average price of a home in Del Mar, CA took a nice bump, but does that mean that the house at 123 Main Street went up in value by over 50%? Sadly, no. Similarly, when and if that bad boy sells, the mean price of homes in Del Mar will drop correspondingly, but the value of 123 Main will not be affected at all.
So, to all of you living in on the Peninsula crying in your Cheerios because you read in The Chronicle that home values in California are off by 20%, RELAX, and ask your Realtor what is really happening with the market in YOUR neighborhood.
Rember, real estate is LOCAL, especially here.
Thanks for reading.
Tags:
Altos Research,
average home price,
home prices,
home values,
median home price,
Menlo Park,
palo alto home prices,
real-estate-market,
statistics
[Read more →]
Tags: Real estate
January 16th, 2008 · 7 Comments
Mark Twain, it seems, merely popularized, but did not actually coin the phrase Lies, Damn Lies, and Statistics. That honor belongs to none other than the British statesman Benjamin Disraeli, the first Earl of Beaconsfield, KG, PC, FRS. (With all these acronyms after his name, one wonders if he may have been the first Realtor!)
I’ve ranted not infrequently about how real estate is local, local, local. What nationwide, statewide, or countywide prices are doing may or may not reflect your city. The overall trends in your city may not be a good indicator of your particular neighborhood.
And that’s where Benjamin Disraeli’s famous quote come in. You can make numbers tell whatever story your bias prefers.
The story I’m about to tell is hyperlocal if ever there was one. If you’re not in this immediate area, the lesson for you is not in these specific numbers, but in the notion that you have to understand your local market.
Here, for instance, is a pretty bad story to tell, and it appears that the story, as told by the great numerical storytellers of Altos Research, is quite simple: home prices in Menlo Park are in freefall, with the median having dropped from an all-time high of $1.65M in mid-2005 to a current $875K-ish. 2007 prices have — apparently — dropped by 30%:

That story just doesn’t make sense to me, however. The marquee towns up and down the Peninsula — those with good schools and their associated high prices — have actually done quite well over the last year. Why would Menlo Park be any different?
Palo Alto: Median prices mostly up last year, with a retreat in the latter part of the year, and signs of another season upsurge upon us…

Los Altos: An incredible run-up in prices, again with a dip last year, and again with a sign of a revival this year…

Los Gatos: A rise last year, though not as much as the other towns, and a pullback in prices in the latter part of the year…

You get the picture. Why then is Menlo Park so different? Have prices really dropped by 30%?
The answer? Most emphatically not!
In fact, take a look at these numbers, pulled from our local MLS. Of the twelve Menlo Park neighborhoods, only two of them had median prices go down in 2007 — and then only by 2-3%. Other neighborhoods saw medians rise from 5.6% (Flood Park) to 35.6% (Alpine Road Area.) The following graph shows the percentage change in median prices from 2006 to 2007.

How can both of the following two facts be true?
- Median home prices in Menlo Park have dropped by 30%
- Median home prices in 10 of 12 Menlo Park neighborhoods have risen, while median home prices in the remaining 2 neighborhoods have fallen, but only modestly.
The answer, Mssrs. Disraeli and Twain, lies in a different statistic: the amount of inventory on the market. Take a look at the story told in this graph, which shows the number of homes sold per year by neighborhood:

The sheer amount of data in this graph, and its size, makes it hard to read. The key points: the number of home sales in Menlo Park in 2007 was just over 400 — significantly lower than the wild years of 1999, 2004, and 2005. The number of homes in the “East of US 101″ neighborhood — the least expensive one – however, increased dramatically. The average number of annual sales in that neighborhood is 36, but last year there were fully 69 — just about double — the number of sales. In the higher-priced neighborhoods, on the other hand, there were fewer sales than normal.
Another graph…this one showing how many sales typically happen in a year in each neighborhood, followed by how many sales happened in 2007:

The lowest-priced neighborhood — East of 101 — had a dramatic increase in the number of transactions; almost every other neighborhood — in particular the expensive ones had fewer sales.
So this, ladies gentlemen is the key story that Mssrs. Disraeli and Twain — not to mention my stats professors — would want us to understand:
- The median price of homes in Menlo Park has indeed dropped in 2007.
- The price of most individual homes in Menlo Park, however, has actually increased in 2007: that is, most homes were worth more at the end of 2007 than they were at the end of 2006.
- The anomoly between the above two points is explained simply by the mix of the homes that were sold: 2007 saw a much higher than normal proportion of less expensive homes.
Tags:
Altos Research,
Flood Park,
Los Altos, Los Gatos,
Menlo Park,
MLS,
Palo Alto,
Real estate
[Read more →]
Tags: Consumer · Industry · Menlo Park · Palo Alto
Tomorrow (1/10/08) Ben Bernanke is scheduled to speak on his outlook on the economy, and the pundits are all expecting that by examining his comments repeatedly, reading tea leaves, and consulting their favorite oracle, they will be able to predict whether the US economy will slide into recession in 2008, and whether the Fed will cut interest rates again at their next meeting.
The stock market seems optimistic, with trading up today as investors shifted into sectors that are seen as resistant to recession and economic contraction. These are things that we spend on whether things are good or bad; food, medical care, gasoline and heating oil.
Some economists say we are already in recession because of a jump in unemployment in December coupled with little growth.
Nationally, I tend to agree with the doomsayers. Here in Palo Alto, Los Altos, Mountain View and Menlo Park however, we are still beneficiaries of the strong local economy. Local executives are still complaining that they can’t hire enough engineers, the housing market continues to be strong as we are seeing a net inflow of people, and minimal relative increase in housing (no more land), and we have a unique concentration of educational instituions, venture capital and innovation that enables Silicon Valley to continue to reinvent itself.
In summary - We will likely see a national recession in 2008 and 2009, with housing prices potentially falling by up to 30% in some areas where prices have been driven up by speculators/investors. The local real estate market will remain constrained by supply, so we will see fewer homes being sold, but prices will remain at current levels, or even continue to increase. Great news if you are planning to sell your home in Palo Alto, bad news if you want to buy in Palo Alto.
In the Central Valley this will sadly not be the case . . .
Stay tuned for a recap of tomorrow’s commentary by Fed Chairman Bernanke.
Thanks for reading.
Tags:
4---mortgage-mania, economy,
Los Altos,
Menlo Park,
Palo Alto,
palo alto economy,
palo alto real estate market,
Real estate,
recession
[Read more →]
Tags: Consumer
A few days ago I spoke about the effect a mythical local insect, Vendus Encourigitis, has on housing inventory patterns here in Silicon Valley. It quite dependably comes out in the early part of each year, spraying homeowners with pheromones that make the notion of selling their home completely irresistible, thus putting an end to the seasonal problem we have here of low inventory. A close cousin of said insect, Achetus Encourigitis, tends to come out shortly thereafter, encouraging buyers to compete with eachother to buy the new inventory and drive prices up.
 To continue the allegory, we look at another creature, this time a real one, but again with an allegorical function in this tale. I speak of the lowly plankton, a tiny oceanic life form: in size, seemingly insubstantial, but in importance, great. The plankton, you see, is at the bottom of many aquatic food chains, and if it were for some reason to disappear, the effect would be disastrous for the creatures that depend on it for food, and for predators of the creatures that depend on the plankton, and so forth: a ripple effect ultimately reaching most aquatic life.
The plankton of local real estate is the humble first-time homebuyer in the lower priced areas such as Redwood City, East Palo Alto, Menlo Park east of 101, parts of Mountain View and San Jose, and so forth. These folks purchased their homes in the last few years, assuming (as we all did) that prices would continue to rise, and they could then “move up” into a ritzier neighborhood with the equity they had built up. A higher than normal percentage (for this area) of such purchases were made with sub-prime loans.
Fast forward to 2008…these markets are hurting, some of them quite badly.
East Palo Alto’s inventory, for instance, has been marching steadily and worryingly upwards since early 2007…

…and prices have been going in the opposite — and expected — direction:

When inventory is over three times what it was a year ago, and prices have dropped by over 15%, the market basically freezes. Deflation does what it always does: makes the bargain-hunters decide to continue salivating just a bit more, because surely those prices are going to continue going down! Homes sell more slowly, prices continue downwards…it’s a vicious spiral.
And the plankton who own these homes? Well, if they can’t sell, that means they can’t buy the $850K starter home in Flood Park…and that homeowner can’t buy the $1.1M home in Palo Alto…who in turn can’t upgrade to the $1.6M property in Los Altos he’s been salivating over…who in turn can’t move to a respectable venture-capitalist-ridden neighborhood in Atherton.
The sub-prime woes affecting the lower-end markets are bound to eventually impact Palo Alto and its kin — though probably not as much as this analogy makes it sound. Why? In this market, there are plankton at almost every price point, so homeowners looking to sell don’t necessarily need to wait for a $500K homeowner to be able to sell his home. For every East Menlo Park’ian who was planning to — but no longer can — move across the 101 to buy an $850K home, there’s a dual-income tech couple who’s looking for the same $850K as their first home. Higher up the food chain, newly minted Googlers represent the plankton of the Atherton market.
But make no mistake about it: the lower end markets here are hurting, and will continue to do so for a while.
For instance, Redwood City’s inventory, much like East Palo Alto’s, is more than triple where it was a year ago…

…and prices in the two lowest quartiles are not looking pretty:

Tags:
Atherton,
Flood Park,
Google,
Menlo Park,
Mountain View,
Palo Alto,
Real estate,
Redwood City
[Read more →]
Tags: Atherton · Consumer · East Palo Alto · Flood Park · Los Altos · Menlo Park · Mountain View · Palo Alto · Redwood City · San Jose
Recent sightings of Vendus Encourigitis — a local Palo Alto insect that emits pheromones that make sellers drop everything they’re doing and get their home on the market immediately — indicate that 2008 may turn out to be a similar year to several of its predecessors.
Here’s how this insect affects the local inventory cycle…
Buyers, sellers, and real estate agents go into Trypophan-induced hibernation around Thanksgiving, and tend not to wake up till early January. Not many new homes come on the market during that time, and not many buyers are out looking for them. This tends to be a time of uncertainty in the market: sellers are not confident about putting their homes on the market because, well, other sellers aren’t putting their homes on the market; similarly, many buyers are spooked out of the market because they aren’t seeing crowds of competition at open houses — ergo, this must not be a good time to buy.
Putting aside all questions of whether such assumptions and actions are rational or not, come January, swarms of Vendus Encourigitis descend on the city and — kablooei!!! — before you know it, the market gets unstuck, sellers finally put the for-sale sign up, and inventory starts its predictable upward march. Shortly thereafter, a related insect — Achetus Encourigitis — begins its work on the buyers, and sure enough, they descend en masse on open houses and begin buying.
Data provided by our friends at Altos Research shows us the pattern for the last couple of years: inventory is at a low at the end of the year, and begins to increase as soon as January rolls around:

A number of nearby towns exhibit similar patterns…
Saratoga:

Los Gatos:

What’s interesting about Los Gatos is that its beginning of the year inventory is somewhat higher than it normally is. Arn Cenedella* of Coldwell Banker notes a similar pattern in Menlo Park real estate, while Dave Blockhus*, also of Coldwell Banker, notes that Los Altos’ real estate inventory pattern is more similar to Palo Alto’s.
Further up the Peninsula, Burlingame has a similar pattern:

Roughly the same trend happens in many of the marquee towns up and down the Peninsula, while in the less tony towns a completely different picture is emerging — more on that in a later post.
* Dave and Arn are both clients of 3 Oceans’ sister company Domus Consulting.
Tags:
Altos Research,
Buyers,
Coldwell Banker,
Inventory,
Menlo Park,
Palo Alto,
Real estate,
Sellers
[Read more →]
Tags: Altos Research · Buyers · Consumer · Palo Alto · Sellers
December 20th, 2007 · 2 Comments
The Zillovians have been busy lately…first, singing a Zillow-fied Christmas carol…then, more substantively, releasing their new Smart Search technology, which, if I understand correctly, presents different information intelligently, based on where and at what zoom level you’re searching.
At the San Mateo county level, for instance, I get this:

At the city level, this is what I get for Menlo Park:

If I want more info on Menlo Park, I learn that local residents
- are well-educated
- are often multi-lingual
- are likely immigrants
- spend more money on housing compared to others
- ride their bikes to work
With the exception of the latter, it seems spot on.

Nice new features, but nothing earth-shattering.
What I’d really like to see from Zillow is something I’ve talked about before: addressing the advertising needs of buy-side Realtors. The Sellsius twins have weighed in on this issue as well.
Here’s what I have in mind: The advertising emphasis in real estate has always been on the listing side. If a home is for sale, that represents more than just an upcoming commission check for the listing agent: done correctly, it’s also marketing collateral. It’s an excuse to send out more branding postcards, to take out an ad in the paper, to hold open houses, to put out a sign…all things designed more to enhance the branding of the agent than to necessarily sell the home in question.
If the fact that I am selling a home or I just finished listing and selling my client’s home is good marketing collateral, why not make something of I just helped my clients buy a home?
We do a bit of this in the industry already: witness the occasional “represented buyer” newspaper ad — which is often just space filler around the more prominent “just sold” ads.
Zillow has a perfect opportunity here. While most of the online real estate conversation is about homes currently on the market, Zillow’s repository of all homes is perfect for telling a broader story, one which includes the buyer’s agent.
Hey Zillow — in your next product release, make it possible for the buy-side agent to tout their recent transactions too!
Tags:
Advertising,
Industry,
Menlo Park,
Real estate,
Technology,
Zillow
[Read more →]
Tags: * Export · Industry


