Tales From the Front 1/31/2010 – The Return of the Tulips

January 31, 2010

I have been patting myself on the back over the results of my contrarian marketing of 842 Sycamore Drive in Palo Alto.

842 Sycamore Drive, Palo Alto

It sold in a week with 14 offers, when the average Days on Market for a home in that area and price range is about 100.

Part of my contrarian marketing was to put it on the market during January, before the “traditional” beginning of the spring market, which is the week after SuperBowl Sunday. With the recent sales activity, I’m expecting a number of homes to come on the market starting in mid-February, as most agent “hold” listings until then. I have confirmed this with a number of my colleagues who are big “listing agents” meaning they hang signs in front of a lot of houses. (Most of my work is with Buyers).

Another house on Greer in the same neighborhood on and price range (listed at $979,000), received 12 offers and sold for very near what Sycamore did. Both homes had over 100 visitors to the open houses and the offers landed in the same ranges.

One question that came up immediately was “These are so similar, I wonder how many buyers are writing offers on both homes?” I haven’t been able to confirm anything, but I have a sneaking suspicion that the same 12 – 15 people were writing offers on both of these homes.

If this is the case, then the entry level market in Palo Alto is like a game of musical chairs. The same 12 – 15 people are going around writing offers on homes, and with every sale one drops out. After 12 rounds or so, they all have homes and the market stops.

So, when the conventional wisdom listings hit the market in February, there will be a flood of inventory, and choices, so the number of offers per home will likely drop off as buyers have more choices and less of a feeling of scarcity. In the case of the homes mentioned above, that would have resulted in a loss of thousands of dollars in proceeds to the sellers, but great news for the buyers of those homes.

This is all speculation now, but worth keeping an eye on over the coming months as we wait to see if the market is returning, or if we are seeing a short-term blip driven by a very limited supply in shortage to a relatively limited demand.

Thanks for reading . . .

Mortgage Mania 25 – What’s Next?

November 3, 2009

Last week I attended a lecture given by economist Chris Thornberg of Beacon Economics on the economic forecast for 2010. The event was sponsored by accounting firm Petrinovich ,Pugh and Co., and Bridge Bank. You can view Dr. Thornberg’s recent presentations on the Beacon Economics website, and his talk from last week HERE.


The digest version is that we will continue to see positive economic news and growth through 2010, but much of that will be driven by the various government funded stimulus packages, which will be ending next year. Since these programs can’t go on forever, Dr. Thornberg predicts that we will see stagnation in 2011 due to the double whammy of unemployment and defaults in the commercial real estate market. Yes, the hits just keep on coming!

We continue to see the following strata in the single-family home market across our area. Here is how the Palo Alto market is currently behaving:

  • Under $800,000 we continue to see some multiple offers and some homes selling briskly for over the list price as buyers are enticed into the market by low down payment (3.5% down), FHA backed loans up to $729,750. New home builders are adding pricing and rate incentives, with some offering 3% rates, if you use their lender, their contract, their terms.


Lower Quartile Palo Alto

Palo Alto $1M - $1.25M, Oct. 2009 vs. Oct. 2008


  • $800,000 – $1,500,000 homes are selling more slowly as buyers need 20% – 25% down payments and substantial cash flow to qualify for mortgages in this price range versus the FHA backed loans mentioned above.
Palo Alto $1.25M - $2M, Oct. 2009 vs. Oct. 2008

Palo Alto $1.25M - $2M, Oct. 2009 vs. Oct. 2008


  • $1,500,000 – $2,000,000 has had an uptick in sales activity in the last month relative to Summer, as buyers in this price range have come back out and absorbed much of the available inventory.


$2M - $3M vs. 1 year ago

$2M - $3M Oct. 2009 vs. Oct. 2008

Homes in Palo Alto over $3M, 10/09 vs 10/08

Over $3M, Oct. 2009 vs. Oct. 2008


  • Over $2,000,000 we are seeing fewer sales and some homes selling at large discounts from listed prices as those owners are overextended and are under financial pressure to sell. Recently, there was a $3.3M short sale in Los Altos, and a $1.8M foreclosure sale in Palo Alto.


Armed with this information, if you are considering selling, early 2010 is the time to take advantage of the current consumer optimism and positive economic news and sell in a relative high (Relative compared a year ago that is, not compared to 2006). As mentioned above, inventory is low relative to demand, especially for updated, attractive homes, and those priced under $2 million are selling. The market above $2 million is moving, but more slowly.

Dow Above 10,000 For The First Time in a Year – Housing Prediction to Come True?

October 14, 2009

The Dow Closed Above the magic 10,000 mark for the first time in over a year, meaning that our 401(k)’s should be back from being 201(k)’s, and that it is time to test my response to the question “What will it take for the housing market to come back?”

I have been saying “Dow over 10,000″, with the logic that a great deal of our local wealth was held in stock on various mutual and hedge funds, and so stocks rebounding to near 2007/2008 levels would return that wealth to our stock accounts, with a little consumer optimism coming along for the ride.

While I never claimed to be Carnac the Magnificent, let’s see how the market has been responding to the rise of the Dow over the last month or so.

Median Home Price for Palo Alto 2008 vs. 2009

Strike 1: The median price of a home for sale in Palo Alto is about $200K lower than a year ago.

Top Quartile Home Prices 2008 vs. 2009

Strike 2: My theory that homes in the top 25% of the market are more sensitive to swings in wealth, IPO activity and stock values seems to have sprung a leak as well. The top of the market was on an upswing a year ago, and prices have dropped a bit over the last couple of weeks.

I’m going to quit while I’m ahead, but will defend my prognostication with the observation that the mix of homes can cause the median to bounce around a bit as well.

If you are a data junkie too, you can receive free weekly reports on the cities and ZIP Codes of your choice via email by subscribing at www.REMarketReports.com. No Spam, and opt out at any time.

Thanks for reading, and I hope you are well diversified.

What Happened To The Market? – A retrospective on June 2009

July 6, 2009

With the warming weather, June saw the market continue to heat up, as Buyers jumped back into the market aggressively, resulting in strong sales across the area, especially for single-family homes under $1.5 million. Homes that are attractive to the bulk of the market, with updates, attractive floorplans, and four bedrooms are commanding multiple offers again, with a few homes in Los Altos and Palo Alto recently receiving over ten offers and selling for cash.

A combination of continuing low interest rates, rising consumer confidence ( we are getting used to bad economic news), and the closing window for tax incentives, is fueling the current buyer activity, so we will see how long this will continue. The state is running out of funds for it’s tax rebate, but the US government has the printing presses running to fund its programs.

The Anderson School of Business at UCLA released its latest report for the California economy last week, and senior economist Jerry Nickelsburg writes “there is nothing happening in California that will help pull the state out of recession in advance of the nation.”

“The dire conditions surrounding the state budget will contribute to prolonging tough conditions in California, according to the report.

Yet that the real risk for California, Nickelsburg writes, is the possibility that there will be no budget agreement at all and that the chaotic and inefficient spending cuts that would likely follow would have an even more severe impact on the ability of California to stem the downturn in economic activity this year.

Overall, the forecast for California is for a very weak first two quarters of 2009, to be followed by very little growth in the last six months of the year. The economy will begin to pick up in 2010 and return to more normal levels of growth in 2011.

The expectation is that total employment will contract by 3.5 percent in 2009 and will not grow in 2010. Once growth returns in 2011, it will rise at 1.8 percent.”


The high-end, over $3 million continues to lag, as usual, but the lack of stock profits and the international economic downturn has really depressed the market for luxury homes over $5 million. Two noteworthy listings in Portola Valley and Woodside really symbolize the luxury market currently.

1990 Portola Road in Woodside has been on the market for two months, and just was reduced from $12,500,000 to $8,500,000. That isn’t a mis-print. So much for the benefit of Larry Ellison living next door. . . . This could be an excellent opportunity for the right buyer. If you are interested, I’d be happy to show it to you.

In Portola Valley, 5070 Alpine Road is Portola Valley’s first REO property. Priced at $7,895,000, the bank is willing to provide attractive financing terms on a $1.2 million down payment. Again, I’d be happy to show it to you if you are interested and a $6.6 million mortgage doesn’t frighten you.

On to the numbers:

Atherton:

Currently, the Median Price of a Single Family Home in Atherton is $4,095,000 with a range of $1,075,000 to 16,800,000. 36% (versus 48% last month) of the homes in Atherton have had price reductions, as Sellers are accepting that the market has shifted, and the average number of Days on Market is 132 days versus 133 last month.

Menlo Park:

The Median Price of a Single Family Home in Menlo Park is $1,297,000. 39% (versus 38% last month) of the homes in Menlo Park have had price reductions, as Sellers are resisting that the market has shifted, and the average number of Days on Market has risen to 135 days from 127 last month. If you look at individual homes, the ones that are well prepared and marketed are still selling quickly, some with multiple offers, while those that are overpriced, or are less desirable due to location, odd floor plans or deferred maintenance issues are being passed over.

Palo Alto:

The Median Price of a Single Family Home in Palo Alto is $1,595,000. 41% (versus 41% last month) of the homes in Palo Alto have had price reductions, as Sellers are resisting accepting that the market has shifted, and the average number of Days on Market has fallen slightly  to 96 days from 99 last month.

Good News About Real Estate in the Mercury? Well Sort Of

September 2, 2008

Long-time readers know that I do my newspaper reading online via the New York Times. In a throwback to a quieter time, I do subscribe to the San Jose Mercury News on Sundays as we like to peruse the articles and share witty banter about the headlines over morning coffee. In an interesting twist, I also receive the paper on other random days of the week . . . but I digress.

When I picked up the paper on Labor Day (Second Sunday?), the headline “Home Sales Raising Hopes” bravely attempted to be seen over the front and center HURRICANE HITS GOP main headline. What’s this I thought, positive news about the housing market from the Merc? Really?

I have grown weary and wary of the Merc and its drumbeat of foreclosure of the week, gloom and doom, and reinforcing that real estate is local, and my market in Palo Alto varies just a bit from south San Jose. If you don’t believe me, visit Altos Research and compare the chart for median home price over the last couple of years in these two cities. The results may surprise you . . .

The Merc got my hopes up with an intro and a couple of quotes from brokers saying they were expecting an upturn in sales in the Fall after activity was so low in the summer, and there is usually an upturn in the fall. There is some back and forth, and the article pretty much shot down the “fall uptick” conventional wisdom. Again, Altos to the rescue showing inventory and sales actually DO pick up in Palo Alto fairly consistently every fall before slowing down over the holidays.

To see the article on its entirety, click here to visit the Mercury online. For charts and stats galore, visit the Market Reports page on my website, now in Single Family and Condo!

Thanks for reading . . .

Timing the Market, A Banker’s Viewpoint

September 1, 2008

Credit for this post really goes to 3 Oceans contributor Eric Trailer who sent me this content in a letter this week. My clients got it last week, and the blogoshpere can now benefit. We can assume that Eric has better things to do on Labor Day than blog. I’m guessing something involving his lovely wife and son . . .

To see current market data and price trends over the past year for local communities and confirm or refute Eric’s prognostications on the local market in Palo Alto and the surrounding communities,

CLICK HERE to see real-time market data, courtesy of our friends at Altos Research.

As you have likely been hearing, there continues to be more and more evidence that it will cost prospective home buyers more to purchase a home in select areas of the Bay Area as they allow time to go by.
Why? Let’s look at the basic reasons, then review an example:

1.        The median price across the board in Palo Alto and the surrounding communities has risen since the beginning of the year.

2.        On a national basis, the trough of the market was reached in April.

3.        The conforming loan limit will DECREASE over $100,000 in 2009 to $625,000.

4.        Rates have risen about .5% since the beginning of the year, despite the increase in the conforming loan limit to $729,750

5.        Loan qualifications are becoming more restrictive with each passing week.

6.        More restrictions on loans and a tighter supply of money forces rates to go up

7.        Because loans require more work to process them (requirements today are 4x what they were a year ago), rates will go up.

8.        Inflation is the number one concern of the Fed, and should be the number one concern for all of us.

Let’s say for a moment that you agree that rates are on the rise, but feel as though prices may come down on a $1mm property today; thus, you want to wait. Let’s further assume that you are right and the future price is $950,000, but rates have increased .5% at that future time. Using 20% down, waiting just cost you an ADDITIONAL $117 per month-over $1,400 per year.

But now let’s be more realistic given the appreciation rates of desirable areas of the Bay Area. If rates increase and the $1mm home appreciates to $1,050,000, you are looking at an ADDITIONAL $550 PER MONTH-OVER $6,000 PER YEAR!

What’s the take-away here?   Price matters much less than true cost… My motto has always been that it always pays off to buy sooner than later, provided your holding period is greater than four years. And to prove that I walk the walk, I am happy to share my personal situation written as an article titled, “How to Afford a Home in Palo Alto Without a Trust Fund.”

Kindest regards,

Eric

To call Eric on his walking the walk comment, and get a copy of his article, “How to Afford a Home in Palo Alto Without a Trust Fund.”, click on his pretty picture over there in the contributor column to send him an email.

Lies, Damn Lies and Statistics – Part 2

January 16, 2008

I want to underscore the importance of what Kevin is discussing in his post regarding statistics and the actual market activity that they represent. Because the neighborhoods in Menlo Park are not distinguished by ZIP code or city, which are two popular methods of segregating data, it is easy to draw an incorrect interpretation of what is happening there.

The Band-Aid fix that I have been using with my clients interested in Menlo Park is to explain the nature of the market, and then look at the market data for the upper two quartiles of homes only. Conveniently, the homes in the areas of Menlo Park East of 101 are all below the mean for the whole city, while those West of 101 are generally above the mean overall.

Scott at Altos Research sent me the following interesting bit of analysis of how an outlier can throw off the statistics for an area. It seems there was recently at home in Del Mar in Southern California listed for $76 million.

The Median home price is reflected here (Median = half the homes on the market are listed above this price, half below):

Median Home Price for Del Mar

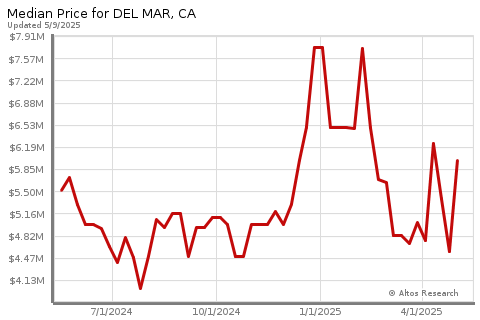
The numbers are weekly, and we can see how having a limited number of data points (homes for sale) bounces the numbers around. 

Maximum price for Del Mar during the same period:

Max Price for homes in Del Mar

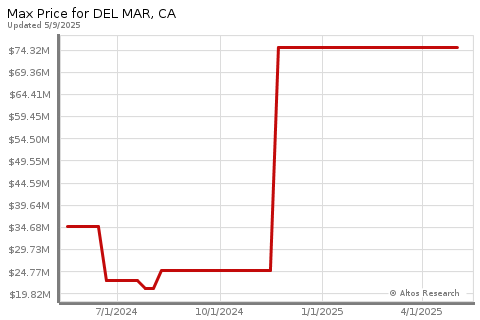
Gee, I wonder when that house was listed, and what the selling commission is?

And here is how the mean (average) price of homes in Del Mar, California is affected as a result:

Mean price in Del Mar

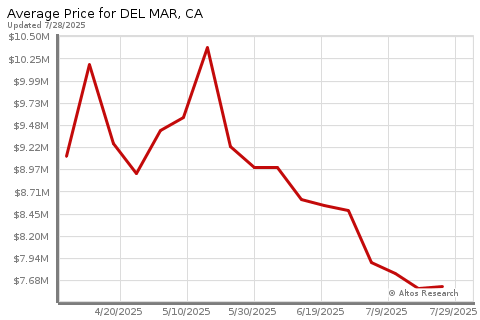
So, the average price of a home in Del Mar, CA took a nice bump, but does that mean that the house at 123 Main Street went up in value by over 50%? Sadly, no. Similarly, when and if that bad boy sells, the mean price of homes in Del Mar will drop correspondingly, but the value of 123 Main will not be affected at all.

So, to all of you living in on the Peninsula crying in your Cheerios because you read in The Chronicle that home values in California are off by 20%, RELAX, and ask your Realtor what is really happening with the market in YOUR neighborhood.

Rember, real estate is LOCAL, especially here.

Thanks for reading.